
See more categories
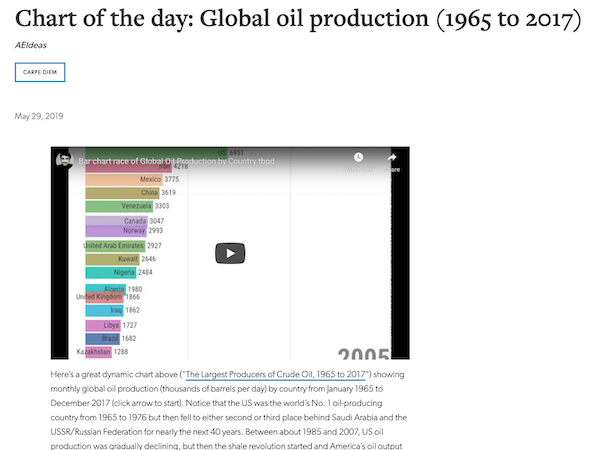
Chart of the day: Global oil production (1965 to 2017)
Posted on11 Oct 2019
A great dynamic chart showing monthly global oil production (thousands of barrels per day) by country from January 1965 to December 2017.
To read the full article, click here


